
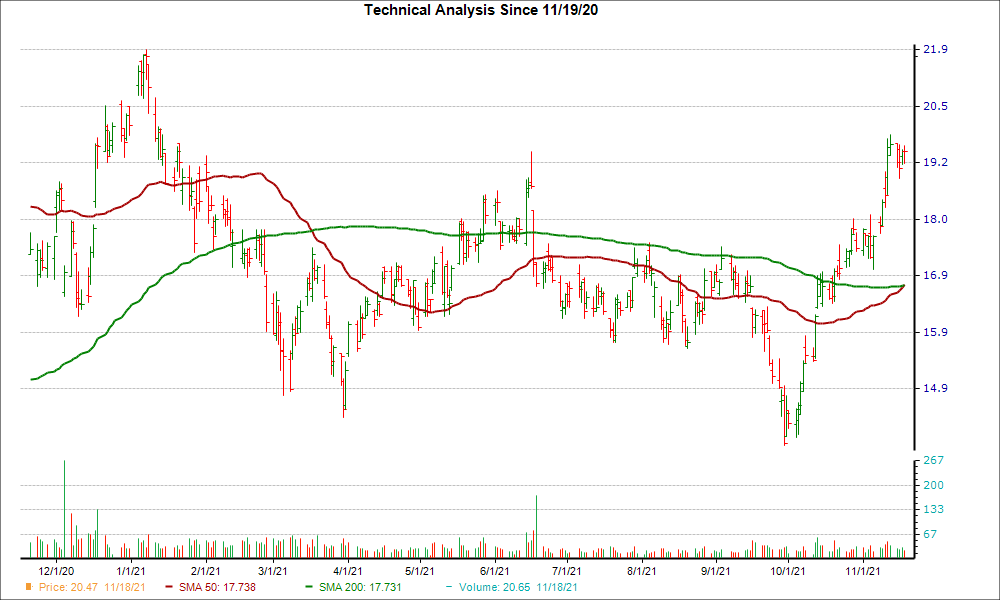
From a technical perspective, Seabridge Gold, Inc. (SA) is looking like an interesting pick, as it just reached a key level of support. SA’s 50-day simple moving average crossed above its 200-day simple moving average, which is known as a “golden cross” in the trading world.
A golden cross is a technical chart pattern that can signify a potential bullish breakout. It’s formed from a crossover involving a security’s short-term moving average breaking above a longer-term moving average, with the most common moving averages being the 50-day and the 200-day, since bigger time periods tend to form stronger breakouts.
Golden crosses have three key stages that investors look out for. It starts with a downtrend in a stock’s price that eventually bottoms out, followed by the stock’s shorter moving average crossing over its longer moving average and triggering a trend reversal. The final stage is when a stock continues the upward climb to higher prices.
A golden cross contrasts with a death cross, another widely-followed chart pattern that suggests bearish momentum could be on the horizon.
SA has rallied 14% over the past four weeks, and the company is a #2 (Buy) on the Zacks Rank at the moment. This combination indicates SA could be poised for a breakout.
The bullish case solidifies once investors consider SA’s positive earnings outlook. For the current quarter, no earnings estimate has been cut compared to 1 revisions higher in the past 60 days. The Zacks Consensus Estimate has increased too.
Investors may want to watch SA for more gains in the near future given the company’s key technical level and positive earnings estimate revisions.
More Stock News: This Is Bigger than the iPhone!
It could become the mother of all technological revolutions. Apple sold a mere 1 billion iPhones in 10 years but a new breakthrough is expected to generate more than 77 billion devices by 2025, creating a $1.3 trillion market.
Zacks has just released a Special Report that spotlights this fast-emerging phenomenon and 4 tickers for taking advantage of it. If you don’t buy now, you may kick yourself in 2022.
Click here for the 4 trades >>
Want the latest recommendations from Zacks Investment Research? Today, you can download 7 Best Stocks for the Next 30 Days. Click to get this free report