Syndicated via Juniorminingnetwork
TSX:PDL
www.napalladium.com
Mr.Jim Gallagher reports:
TORONTO, Sept. 17, 2018 (GLOBE NEWSWIRE) — North American Palladium Ltd. (“NAP” or the “Company”) (TSX:PDL) (OTC PINK:PALDF) announced today the results of a new feasibility study (the “Feasibility Study”), incorporating major changes to the life of mine plan for the Lac des Iles Mine Property (“LDI”) in northwestern Ontario. The Feasibility Study has been prepared in accordance with National Instrument 43-101 – Standards of Disclosure for Mineral Projects and will be filed within 45 days on SEDAR and posted on the Company’s website. All currency figures are in Canadian dollars unless otherwise noted.
Based on the success of the recent transition to the sublevel shrinkage mining method (“SLS”) in the lower part of the mine, the Company initiated an internal evaluation of similar underground mass mining approaches for all of the near-surface resources as an alternative to a pushback of the existing Roby open pit proposed in the prior 2017 feasibility study. The positive results of this evaluation prompted the commissioning of the Feasibility Study. The Feasibility Study has improved margins, cash flows, mine life and net present value (“NPV”) relative to the previous study. Additionally, the more selective underground mining method provides the Company with increased flexibility to deal with any future palladium price volatility.
Highlights of the Feasibility Study:
- The previously planned pushback of the dormant Roby open pit is now replaced by an expansion of the underground mine using bulk mining methods to extract maximum value from several near-surface resources outside the original mine plan.
- Mine life is extended by one year to 2027 with average underground production increasing from 6,000 to more than 12,000 tonnes per day (“tpd”) and includes a total of 40.9 million tonnes of underground and surface reserves at an average palladium grade of 2.31 g/t, yielding 2.32 million ounces of payable palladium production.
- Improved key financial metrics, including total revenue of $3.64 billion, total EBITDA1 of $1.51 billion and after-tax NPV(8%) of $637 million, generated by an average operating margin of 43% ($37.86 per tonne of ore milled).
- Annual after-tax cash flows of between $52 and $144 million, totaling $909 million over the life of the mine.
- Average All-Inclusive Sustaining Cost1 (“AISC”) of US$622 and cash costs of US$504 per ounce of palladium sold, with an average underground mining cost of $33.67 per tonne.
“With the completion of the operational turnaround last year, the Company has now generated positive earnings for five consecutive quarters. The new mine plan outlined in the Feasibility Study generates increased cash flow by optimizing resources previously included in the Roby open pit pushback plan and by adding reserves that were previously sterilized by the open pit design. LDI continues to be one of the lowest cost underground mines in Canada. This new approach will take full advantage of LDI’s large, lower-grade near-surface resources and allow for the mining of more resources at an improved grade than contemplated in the prior 2017 Feasibility Study. The net result is improved operating margins, a longer mine life and greater value creation for shareholders,” said Jim Gallagher, President and CEO of North American Palladium.
“Improved current and long-term consensus for palladium prices also contributed to higher value when compared to the study released 16 months ago. The market has begun to recognize that the primary deficit in the palladium market that has existed for the last few years is likely to continue well into the future. The new Feasibility Study places the Company in a strong position to manage volatility in palladium prices and capitalize on the robust palladium market while continuing to add resources through mine site and greenfields exploration,” continued Mr. Gallagher.
Updated Mineral Reserves and Resources
The new Feasibility Study includes a comprehensive update to the mineral reserves and mineral resources for LDI. The summaries provided below are explained in the accompanying notes at the end of this release and in the new Feasibility Study.
MINERAL RESERVES FOR THE LAC DES ILES MINE
|
| Reserves |
Classification |
Tonnes
(‘000s) |
Pd
(g/t) |
Pd Eq1
(g/t) |
Contained
Pd oz
(‘000s) |
| Offset Underground |
Proven |
3,089 |
2.30 |
3.05 |
228 |
| Offset Underground |
Probable |
17,159 |
3.01 |
4.02 |
1,661 |
| Roby Underground |
Proven |
2,279 |
1.76 |
2.31 |
128 |
| Roby Underground |
Probable |
14,569 |
1.89 |
2.49 |
886 |
| Roby Surface |
Proven |
300 |
1.94 |
2.50 |
18 |
| Roby Surface |
Probable |
80 |
3.11 |
3.63 |
8 |
| Low-grade Stockpile |
Probable |
3,399 |
0.970 |
1.45 |
106 |
| TOTAL |
Proven & Probable |
40,877 |
2.31 |
3.08 |
3,038 |
(Mineral reserves reflect depletion from mining activities up to and including June 30, 2018 – see Notes for more details.1Palladium equivalent grade , estimated using the average grades shown and spot metal prices from September 6, 2018. Includes nickel. No mill recoveries or smelter charges are included in the calculation. Spot prices ($US) from September 7, 2018 are: Pd – $982/oz; Pt – $776/oz; Au – $1198.9/oz; Cu – $2.67/lb; Ni – $5.57/lb. Source: Kitco & LME)
| MINERAL RESOURCES FOR THE LAC DES ILES MINE |
| Resources |
Classification |
Tonnes
(‘000s) |
Pd
(g/t) |
Pd Eq
(g/t) |
Contained
Pd oz
(‘000s) |
| Offset Underground |
Measured |
9,568 |
2.90 |
3.88 |
893 |
| Offset Underground |
Indicated |
18,759 |
2.97 |
4.01 |
1,788 |
| Roby Underground |
Measured |
9,581 |
2.20 |
2.92 |
677 |
| Roby Underground |
Indicated |
26,589 |
1.56 |
2.13 |
1,336 |
| Roby Surface |
Measured |
3,174 |
1.38 |
1.84 |
140 |
| Roby Surface |
Indicated |
1,910 |
1.32 |
1.94 |
81 |
| Low-grade Stockpile |
Indicated |
3,399 |
0.970 |
1.45 |
106 |
| TOTAL |
MEA&IND |
72,980 |
2.14 |
2.89 |
5,024 |
| TOTAL |
Inferred |
8,235 |
2.22 |
2.96 |
– |
(Mineral resources are inclusive of mineral reserves and reflect depletion from mining activities up to and including June 30, 2018 – see Notes for more details.)
The new mineral reserves include several areas not previously captured in the mine plan, including, the Roby Northeast, Roby South and Sheriff South mining areas (Figure 2).
The updated mineral resources include materials added to the southern part of the Offset Zone by exploration and conversion drilling completed since January 2017. The large quantity of mineral resources not included in the current reserves estimate generally reflects isolated clusters of resource blocks separated by areas of low drilling density within the mineral envelope. The mineral resource also includes a large but low-grade mineralized envelope encompassing most of the discrete zones in the Roby block. Many of the resources external to the current reserves are targeted for infill drilling to determine if they can be included in future mine plans.
Feasibility Study Results
The new mining plan features the introduction of sub-level caving to the large, low-grade mineral resource in the central and southwestern parts of the Roby Zone, below and adjacent to the current open pit. The new plan extracts a much larger proportion of the higher-grade resources residing below the pit in the Roby Central Domain, leading to a net increase in the average Roby Zone palladium mining grade. It also accelerates production from these higher-grade resources, leading to an improvement in cash flows in the early years of the plan. The new plan is anchored by the continuation of low-cost SLS mining in the thicker and higher-grade central part of the Offset Zone. It also includes supplemental feed from new selective mining areas in the northern and southern ends of both the Roby and Offset zones (Figure 1 and Figure 2). Surface mining involves the completion of the current operations in the Sheriff Pit by the end of 2018 and selective extraction of the remaining low-grade stockpile reserves to maximize the operating rate of the existing mill. Annual production by source includes approximately equal contributions from the Roby block and the Offset block (Figure 3).
| |
| |
PRODUCTION BY YEAR
|
| |
Ore Mined
(kilo tonnes) |
Mining Rate
(tpd) |
Palladium Head
Grade (g/t) |
Payable Pd
(oz) |
| 2018 H2 |
2,253 |
12,247 |
2.34 |
130,117 |
| 2019 |
4,470 |
12,247 |
2.15 |
234,600 |
| 2020 |
4,470 |
12,213 |
2.30 |
252,892 |
| 2021 |
4,470 |
12,247 |
2.53 |
279,700 |
| 2022 |
4,470 |
12,247 |
2.43 |
268,187 |
| 2023 |
4,470 |
12,247 |
2.43 |
267,738 |
| 2024 |
4,470 |
12,213 |
2.37 |
260,619 |
| 2025 |
4,470 |
12,247 |
2.17 |
237,528 |
| 2026 |
4,470 |
12,247 |
2.19 |
239,178 |
| 2027 |
2,864 |
10,491 |
2.15 |
150,524 |
| |
|
|
|
|
Summary results of the Feasibility Study are highlighted below:
| KEY METRICS OF THE NEW FEASIBILITY STUDY |
| Palladium Reserves (Contained) |
3.038 M oz |
| Palladium Reserve Grade |
2.31 g/t |
| Total Ore Reserves |
40.9 M tonnes |
| Total Underground Ore Reserves |
37.1 M tonnes |
| Average1 Mill Throughput |
12,238 tpd |
| Average Palladium Recovery |
81.3% |
| Total Payable Palladium Production |
2.32 M oz |
| Average1 Payable Palladium Production |
255,000 oz |
| Mine Life |
9 years |
| Average1 Cash Costs2 |
US$504 per oz |
| Total Capital Expenditures |
$425 M |
| Average1 All-in Sustaining Costs2 |
US$622 per oz |
| EBITDA |
$1,505 M |
| After-tax cash flow |
$909 M |
| After-tax NPV(8%) |
$637 M |
(1Based on full production years 2019-2026. 2Net of by-product revenue.)
In comparison to the 2017 feasibility study, total payable palladium production has increased by 14% and underground production has increased by 82%. The average palladium grade increased by 5%, EBITDA increased by 43%, after-tax cash flow increased by 34% and the after-tax NPV(8%) has increased by 36%. AISC has increased by 18%, reflecting a stronger Canadian dollar, reduced by-product revenue, and higher sustaining capital and production costs associated with underground mining. The reduced by-product revenue is primarily due to lower forecasted prices for platinum and gold. The improvement in 2018 numbers takes into account one year of mining depletion included in the previous feasibility study. The improvement in total reserves and palladium production reflects:
- Recent gains from exploration and definition drilling in the Offset block; and
- The inclusion of a much larger proportion of the lower-grade resources in the Roby block based on the adoption of bulk mining approaches.
| COMPARISON OF KEY METRICS FROM THE 2017 AND 2018 FEASIBILITY STUDIES |
| Item |
2018 Study |
2017 Study |
Variance (%) |
| Average1 Underground Mining Rate (tpd) |
|
11,383 |
|
6,250 |
+ 82 |
% |
| Underground Tonnes Milled (millions) |
|
37.1 |
|
20.4 |
+ 82 |
% |
| Surface Tonnes Milled (millions) |
|
3.8 |
|
17.3 |
– 78 |
% |
| Total Tonnes Milled (millions) |
|
40.9 |
|
37.7 |
+ 8 |
% |
| Average Palladium Head Grade (g/t) |
|
2.31 |
|
2.21 |
+ 5 |
% |
| Payable Palladium oz (millions) |
|
2.32 |
|
2.04 |
+ 14 |
% |
| AISC ($US per oz) |
$ 622 |
$527 |
+ 18 |
% |
| EBITDA (millions) |
$ 1,505 |
$1,056 |
+ 43 |
% |
| Total Capital Expenditures (millions) |
$ 425 |
$303 |
+ 40 |
% |
| Post-tax Cash Flow (millions) |
$ 909 |
$678 |
+ 34 |
% |
| Post-tax NPV(8%) (millions) |
$ 637 |
$470 |
+ 36 |
% |
(1Averaged over full production years 2019-2026. Tonne “t”, grams per tonne “g/t”, troy ounce “oz”.)
After tax annual cash flow is illustrated in Figure 4.
Palladium Market
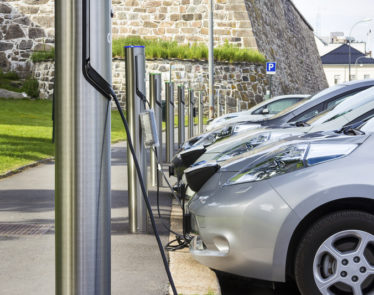
The long-term consensus for the palladium market continues to forecast a physical metal deficit, driven by significant supply risks from declining South African production combined with a growing demand picture. Demand continues to be driven by three key factors including, global auto sales growth, increasing global emissions standards, which require higher palladium loadings, and the continuing move away from diesel engines to more palladium-intensive gasoline engines. An additional factor is the increasing popularity of hybrid-electric vehicles, which require slightly higher palladium loadings to meet emission standards due to their lower operating temperature. The improved results in the new Feasibility Report reflect these updated market fundamentals.
Sensitivities
Sensitivities of the financial results related to macroeconomic assumptions are provided below. The consensus-based average palladium price used in the Feasibility Study is $1,040/oz. The long-term USD/CAD exchange rate is 1.25.
| LIFE OF MINE MACROECONOMIC ASSUMPTIONS |
| |
2018
H2 |
201 |
2020 |
2021 |
2022
fwd |
| US$/oz Palladium |
976 |
1,040 |
1,040 |
1,040 |
1,040 |
| US$/oz Platinum |
903 |
955 |
955 |
955 |
955 |
| US$/oz Gold |
1,290 |
1,276 |
1,275 |
1,305 |
1,290 |
| US$/lb Copper |
3.08 |
3.19 |
3.24 |
3.29 |
3.27 |
| USD/CAD |
1.30 |
1.24 |
1.26 |
1.25 |
1.25 |
| (Source: Bloomberg – median of analyst forecasts; Pound “lb”, Forward “fwd”.) |
PALLADIUM PRICE AND EXCHANGE RATE SENSITIVITIES OF THE POST-TAX NPV ($M) FOR
THE FEASIBILITY STUDY |
| |
|
| |
USD/CAD Exchange Rate |
| Pd Price ($US/oz) |
1.15 |
1.20 |
1.25 |
1.30 |
1.35 |
| $ 850 |
$122 |
$197 |
$271 |
$342 |
$413 |
| $ 950 |
$336 |
$416 |
$481 |
$543 |
$604 |
| $ 1,040 |
$501 |
$569 |
$ 637 |
$702 |
$757 |
| $ 1,150 |
$676 |
$740 |
$801 |
$869 |
$938 |
| $ 1,250 |
$808 |
$884 |
$958 |
$1,033 |
$1,108 |
| (Assumes a discount rate of 8%.) |
|
|
|
|
|
PALLADIUM PRICE AND DISCOUNT RATE SENSITIVITIES OF THE POST-TAX NPV ($M) FOR
THE FEASIBILITY STUDY |
| |
|
| |
Discount Rate |
| Pd Price ($US/oz) |
0 %
|
5 %
|
8 %
|
10 % |
| $ 850 |
$421 |
$317 |
$271 |
$244 |
| $ 950 |
$703 |
$550 |
$481 |
$441 |
| $ 1,040 |
$909 |
$722 |
$ 637 |
$589 |
| $ 1,150 |
$1,128 |
$904 |
$801 |
$743 |
| $ 1,250 |
$1,339 |
$1,078 |
$958 |
$890 |
(Assumes USD/CAD foreign exchange rate of 1.25.)
|
Qualified Persons
The technical content of this news release was reviewed and approved by the Company’s Vice-President, Exploration, Dr. Dave Peck, Mr. Steven Olson, Senior Mining Engineer employed by the Company and Mr. Brian Young, Senior Mining Engineer employed by the Company, all of whom are Qualified Persons under the meaning of NI 43-101. Dr. Peck is a registered Professional Geoscientist with the Association of Professional Geoscientists of Ontario, the Association of Professional Engineers and Geoscientists of British Columbia, and the Association of Professional Engineers and Geoscientists of Manitoba. Mr. Olson is a registered Professional Engineer with the Association of Professional Engineers of Ontario. Mr. Young is a registered Professional Engineer with the Association of Professional Engineers of Ontario.
Note
1 Non-IFRS measure. Non-IFRS financial measures do not have any standardized meaning prescribed by IFRS and may not be comparable to similar measures presented by other issuers.
Notes to Accompany the Mineral Reserves and Resources Tables
- All mineral resource and mineral reserve estimates were prepared in accordance with the CIM Definition Standards (2014).
- Mineral resources which are not mineral reserves do not have demonstrated economic viability. Mineral resources are inclusive of mineral reserves.
- The effective date of the mineral resource and mineral reserve estimates is July 4, 2018.
- The current estimates of mineral resources and mineral reserves on the Property reflect depletion from mining activities to July 1, 2018.
- The estimates of the mineral reserves were reviewed and approved by Steven Olson, P. Eng., an employee of the Company and a qualified person under NI 43-101.
- The estimates of the mineral resources were reviewed and approved by Dave Peck, P. Geo., an employee of the Company and a qualified person under N.I. 43-101.
- The following long-term analyst consensus metal price and foreign exchange assumptions were used for mineral reserves estimation: US$1,040/oz palladium, US$955/oz platinum, US$1,290/oz gold, US$3.27/lb copper and $CAD: $US = 1.25.
- Tonnage and Contained Palladium estimates are rounded down to the nearest thousand tonnes and the nearest ounce, respectively. Row and column totals may not match due to rounding.
- Nickel grade was not considered in the estimation of reserves because it is not a payable metal in the Company’s primary smelter agreement.
- Palladium, platinum and gold prices are from Kitco (www.kitco.com). Copper and nickel prices are from the London Metal Exchange (www.LME.com).
Cautionary Statement on Forward-Looking Information
Certain information contained in this news release constitutes ‘forward-looking statements’ and ‘forward-looking information’ within the meaning of applicable Canadian securities laws. All statements other than statements of historical fact are forward-looking statements. The words ‘target’, ‘plan’, ‘should’, ‘could’, ‘estimate’, ‘guidance’, and similar expressions identify forward-looking statements. Forward-looking statements in this news release include, without limitation: information pertaining to the results of the Feasibility Study (including, without limitation, with respect to projected revenue, production rates, EBITDA, operating margins, cash flows, AISC and NPV); information pertaining to the Company’s strategy, strategic process, plans or future financial or operating performance, such as statements with respect to, long term fundamentals for the business, operating performance expectations, project timelines, tailings management plan, mining method change, production forecasts, operating and capital cost estimates, expected mining and milling rates, cash balances, projected grades, mill recoveries, metal price and foreign exchange rates and other statements that express management’s expectations or estimates of future performance. Forward-looking statements involve known and unknown risk factors that may cause the actual results to be materially different from those expressed or implied by the forward-looking statements. Such risks include, but are not limited to: the possibility that metal prices and foreign exchange rates may fluctuate, the risk that the LDI mine may not perform as planned, that the Company may not be able to meet production forecasts, the possibility that the Company may not be able to generate sufficient cash to service its indebtedness and may be forced to take other actions, inherent risks associated with development, exploration, mining and processing including environmental risks and risks to tailings capacity, employment disruptions, including in connection with collective agreements between the Company and unions and the risks associated with obtaining necessary licenses and permits. For more details on these and other risk factors see the Company’s most recent management’s discussion and analysis and the Company’s annual information form on file with Canadian securities regulatory authorities on SEDAR at www.sedar.com under the heading “Risk Factors”.
This news release also contains references to estimates of mineral reserves and mineral resources. The estimation of mineral reserves and mineral resources is inherently uncertain and involves subjective judgments about many relevant factors. Mineral resources that are not mineral reserves do not have demonstrated economic viability. The accuracy of any such estimates is a function of the quantity and quality of available data, and of the assumptions made and judgments used in engineering and geological interpretation, which may prove to be unreliable and depend, to a certain extent, upon the analysis of drilling results and statistical inferences that may ultimately prove to be inaccurate. Mineral resource estimates may have to be re-estimated based on, among other things: (i) fluctuations in palladium prices or other mineral prices; (ii) results of drilling; (iii) results of metallurgical testing and other studies; (iv) changes to proposed mining operations, including dilution; (v) the evaluation of mine plans subsequent to the date of any estimates; (vi) the possible failure to receive required permits, approvals and licences, or changes to any such permits, approvals or licences; and (v) changes in laws, rules or regulations, including changes to tax and royalty rates whether to be applied prospectively or retroactively.
Forward-looking statements are necessarily based upon a number of factors and assumptions that, while considered reasonable by management, are inherently subject to significant business, economic and competitive uncertainties and contingencies. The factors and assumptions contained in this news release, which may prove to be incorrect, include, but are not limited to: that the Company will be able to continue normal business operations at its LDI mine, that metal prices and exchange rates between the Canadian and United States dollar will be consistent with the Company’s expectations, that there will be no significant disruptions affecting operations, and that prices for key mining and construction supplies, including labour, will remain consistent with the Company’s expectations. The forward-looking statements are not guarantees of future performance. The Company disclaims any obligation to update or revise any forward-looking statements, whether as a result of new information, events or otherwise, except as expressly required by law. Readers are cautioned not to put undue reliance on these forward-looking statements.
About North American Palladium
North American Palladium Ltd. (TSX: PDL) (OTC PINK: PALDF) is a Canadian company with over 25 years of production at Lac des Iles mine, located northwest of Thunder Bay, Ontario. North American Palladium is the only pure play palladium producer in the world. With over 600 employees, Lac des Iles mine features a unique world class ore body, modern infrastructure, including both an underground mine and an open pit mine, and a world class exploration portfolio.
SOURCE: North American Palladium Ltd.
For further information:
North American Palladium Ltd.
Investor Relations
Telephone: 416-360-7374
Email: [email protected]
Photos accompanying this announcement are available at:
http://www.globenewswire.com/NewsRoom/AttachmentNg/cdc50fbd-d1fc-4ff9-90dc-5ddb1cbbb8e5
http://www.globenewswire.com/NewsRoom/AttachmentNg/19ef4634-fd02-4c4f-93c9-321bebb54db8
http://www.globenewswire.com/NewsRoom/AttachmentNg/be431273-15b3-4d35-a8af-f0335c1af691
http://www.globenewswire.com/NewsRoom/AttachmentNg/c8128b5a-4bbe-47c4-8f57-182d4d7a8727
Source: North American Palladium
Featured image: DepositPhotos /©michaeljung